For a flat ΛCDM (standard) cosmology, there is a tension between the estimation of the Hubble constant H0 (current expansion rate of the universe) from observations of the cosmic microwave background and measurements of H0 from late-universe probes, e.g., using SNe data or time delays of gravitationally lensed quasars. Trying to check if this tension is real or not, we are using observational constraints for lensed quasars of the GLENDAMA sample to discuss the underlying value of H0 in a standard cosmology.
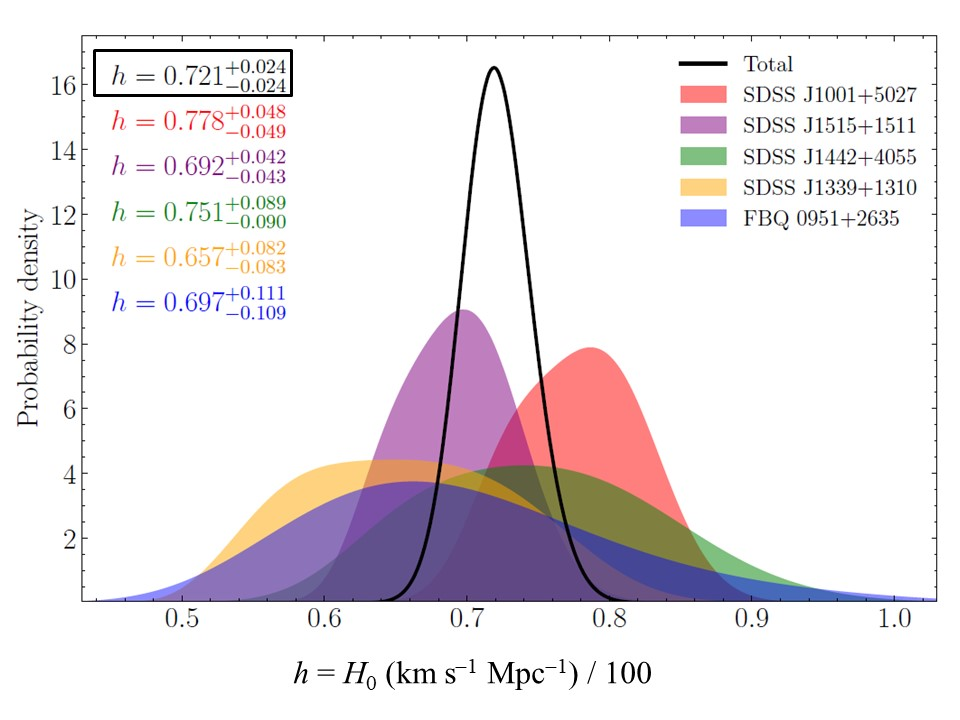
In addition to an initial test on H0 using two double quasars (see this paper), a student at the UC performed a MSc thesis based on GLENDAMA observations of six double quasars. This thesis focused on the mass distributions of the lensing galaxies and the H0 value. A preliminary result (not based on a comprehensive analysis of each system) was H0 = 72.1 ± 2.4 km s−1 Mpc−1, supporting several other results from late-universe probes, but also including measurements from early-universe probes within the 2σ interval (see Fig.1).
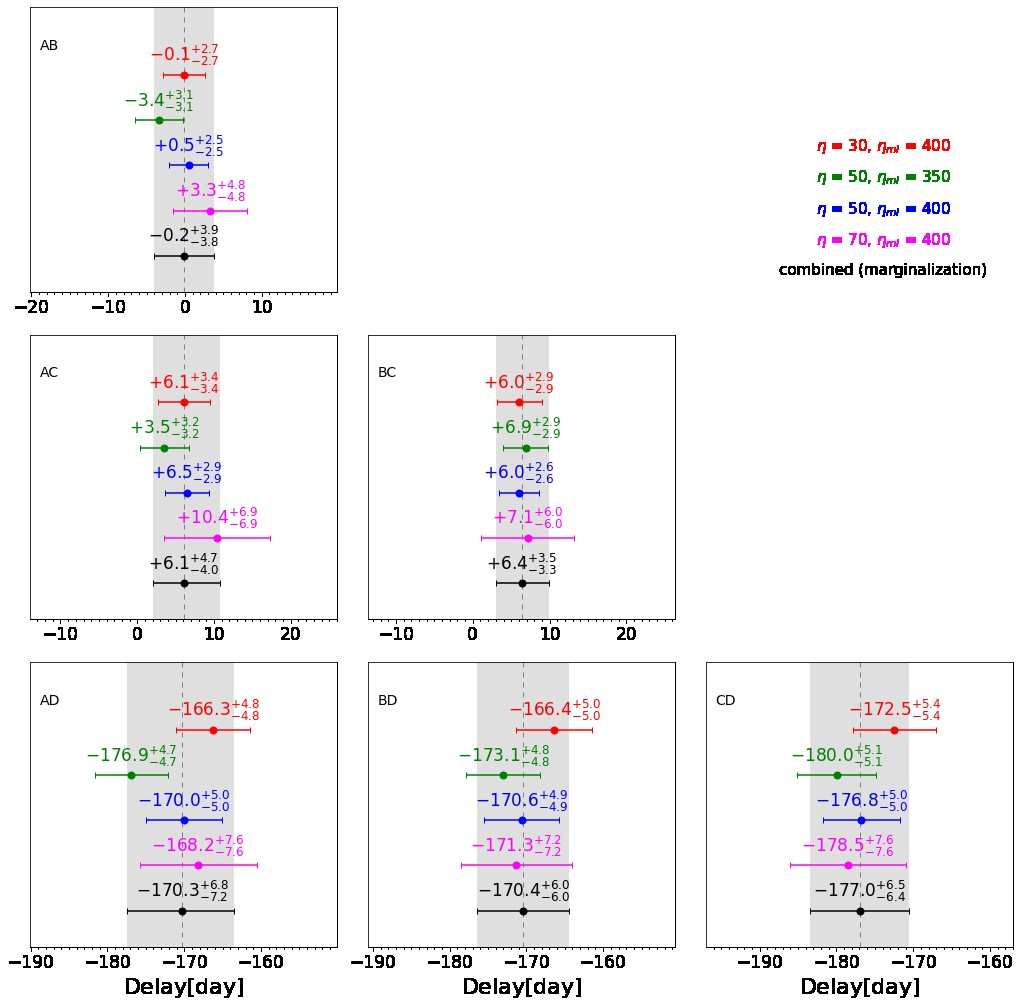
We have also discussed the relationship between the mass distribution and H0 from data of the quad PS J0147+4630 (see this paper). This recent study is based on accurate measurements of the three independent delays relative to the faintest image D using our GLENDAMA data and NOT data obtained by the gravitational lensing group at the University of Oslo (see Fig. 2). We also collaborated in a project to discuss the non-parametric mass distribution of the lensing cluster SDSS J1004 + 4112 and the H0 value from measured delays of the associated five-image quasar SDSS J1004 + 4112 (it is not a target of the GLENDAMA sample and was not observed by us, but is an interesting case in which non-parametric mass reconstructions are used; see paper).