Categorías
News

Revealing the origin of the UV light emitted by Q0957+561

It is thought that the UV emission of a quasar is mainly generated in an accretion disc around a central supermassive black hole and gas clouds surrounding the accretion disc. This accretion disc produces the nuclear continuum, while the diffuse continuum and broad emission lines are generated in the clouds around the central engine (see Fig. 1).

Fig. 1: A long-term monitoring of the variability of Q0957+561 using optical telescopes at Canary Islands allowed us to uncover the contribution to the UV emission of the quasar from different sources. Although the accretion disc around the central black hole (nuclear source) produces ~80% of the UV light, an appreciable fraction (~20%) of the UV emission is generated by gas clouds surrounding the disc. This circumnuclear emission includes both a diffuse continuum (lighter areas of the clouds) and broad lines (darker areas of the clouds).

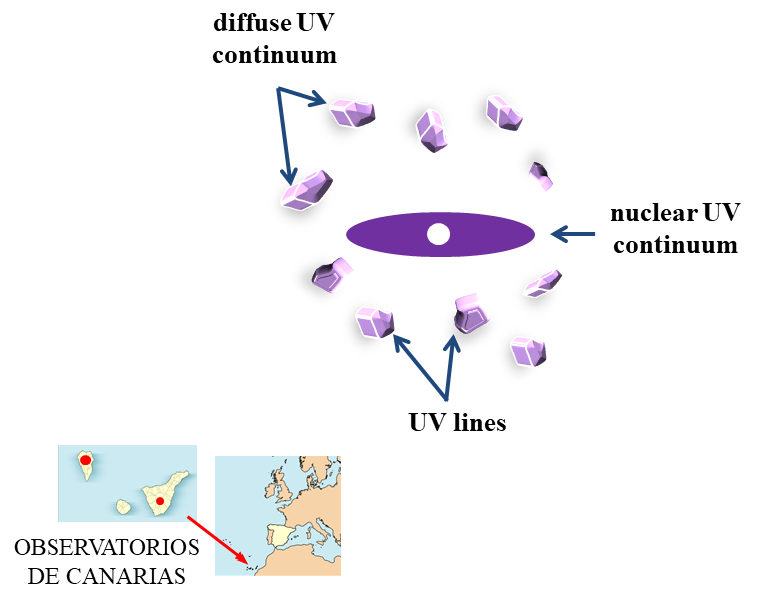
The first lensed quasar (Q0957+561) has two optically bright and widely separated images whose brightness has been accurately monitored during the last 25 years from frames taken at Teide and Roque de los Muchachos Observatories (Observatorios de Canarias; see map on the bottom left corner of Fig. 1).  As optical passband fluxes of this quasar are related to UV sources, the optical light curves of Q0957+561 revealed the origin of its UV emission. Using the light curves in the g and r bands, we found that about 20% of the UV emission corresponding to these passbands is generated within the gas clouds in the circumnuclear region (see this paper). It is also important to emphasize that the tension between the accretion disc size from microlensing and its reverberation-based value may be due to an overestimation from microlensing studies, which usually neglect the contribution of the circumnuclear emission and derive effective sizes (accretion disc + circumnuclear region).

Categorías
News

Cosmology from gravitationally lensed quasars

For a flat ΛCDM (standard) cosmology, there is a tension between the estimation of the Hubble constant H0 (current expansion rate of the universe) from observations of the cosmic microwave background and measurements of H0 from late-universe probes, e.g., using SNe data or time delays of gravitationally lensed quasars. Trying to check if this tension is real or not, we are using observational constraints for lensed quasars of the GLENDAMA sample to discuss the underlying value of H0 in a standard cosmology.

In addition to an initial test on H0 using two double quasars (see this paper), a student at the UC performed a MSc thesis based on GLENDAMA observations of six double quasars. This thesis focused on the mass distributions of the lensing galaxies and the H0 value. A preliminary result (not based on a comprehensive analysis of each system) was H0 = 72.1 ± 2.4 km s−1 Mpc−1, supporting several other results from late-universe probes, but also including measurements from early-universe probes within the 2σ interval (see Fig.1).

Fig. 1: Individual values of h = H0 (km s−1 Mpc−1)/100 using five double quasars. The combined measurement is also shown (black). These Results correspond to a flat ΛCDM (standard) cosmology with matter and dark energy densities of ΩM = 0.3 and ΩΛ =0.7.

We have also discussed the relationship between the mass distribution and H0 from data of the quad PS J0147+4630 (see this paper). This recent study is based on accurate measurements of the three independent delays relative to the faintest image D using our GLENDAMA data and NOT data obtained by the gravitational lensing group at the University of Oslo (see Fig. 2). We also collaborated in a project to discuss the non-parametric mass distribution of the lensing cluster SDSS J1004 + 4112 and the H0 value from measured delays of the associated five-image quasar SDSS J1004 + 4112 (it is not a target of the GLENDAMA sample and was not observed by us, but is an interesting case in which non-parametric mass reconstructions are used; see paper).

Fig. 2: Time-delay estimates using the chi-square technique and free-knot splines (based on PyCS3 software)

Categorías
News

Updating the microlensing simulator (ML simulator): moving stars in the lensing galaxy

We are updating our current ML simulator at https://microlensing.overfitting.es/ by adding a new ingredient: motions of microlenses. Here below you can find an example. In this example, we consider a point-like source. Additionally, both convergence and shear strength are equal to 0.3, and all mass is due to identical stars (microlenses). The physical size of the magnification map covers 20 Einstein radii with a length side of 2000 pixels. The movie lasts 2 minutes, corresponding to the real time of the simulation in a laptop with i5 processor and 16 GB RAM.

Categorías
News

Accretion discs around supermassive black holes

As part of a collaborative research programme between the gravitational lensing groups at the UC, United States Naval Academy (USNA) and other institutions, we have measured the central black hole mass of the doubly-imaged quasar SDSS J1339+1310 using GTC and VLT spectroscopic data. We infer Log(M/solar mass) = 8.6+0.4−0.4 from the widths of the Civ, Mgii, and Hbeta emission lines, and the continuum luminosities at 1350, 3000, and 5100 Å (see figure below). In addition, the 2009-2019 LT light curves in the r band showed significant microlensing variations that allowed us to constrain the half-light radius of the 1930 Å continuum-emitting region. Hot gas responsible for this continuum emission is likely orbiting a black hole of four hundred million solar masses at a half-light radius of only a few tens of Schwarzschild radii.

Paper: Resolving the inner accretion flow towards the central supermassive black hole in SDSS J1339+1310 by V. N. Shalyapin, L. J. Goicoechea, C. W. Morgan, M. A. Cornachione, A. V. Sergeyev [A&A 646, A165 (2021)]

Updated optical-NIR light curves of the gravitationally lensed quasars Q0957+561 and SBS0909+532 also display prominent microlensing features. Using a Bayesian Monte Carlo technique developed at the USNA, these features were analysed to constrain the quasar continuum emission region sizes in the g, r, and H passbands. We report sizes as half-light radii scaled to a 60° inclination angle. For Q0957+561 we measure Log(R1/2 /cm) = 16.54+0.33−0.33 , 16.66+0.37−0.62 , and 17.37+0.49−0.40 in the g, r, and H bands, respectively. For SBS0909+532 we measure Log(R1/2 / cm) = 15.83+0.33−0.33 , 16.21+0.37−0.62 , and 17.90+0.61−0.63 in the g, r, and H band respectively. With size measurements in three bands spanning the quasar rest frame UV to optical, we can place constraints on the scaling of accretion disc size with wavelength, Rλλa . In a joint analysis of both systems we find a slope shallower than that predicted by thin-disc standard theory, a = 2.86+0.84−0.90 (astd = 1.33).

Paper: Near-infrared and Optical Continuum Emission Region Size Measurements in the Gravitationally lensed Quasars Q0957+561 and SBS0909+532 by M. A. Cornachione, C. W. Morgan, H. R. Burger, V. N. Shalyapin, L. J. Goicoechea, F. J. Vrba, S. E. Dahm, T. M. Tilleman [ApJ 905, A7 (2020)]