Categorías
A&A HIGHLIGHTS

Joining forces: 30 years of optical monitoring of the Einstein Cross

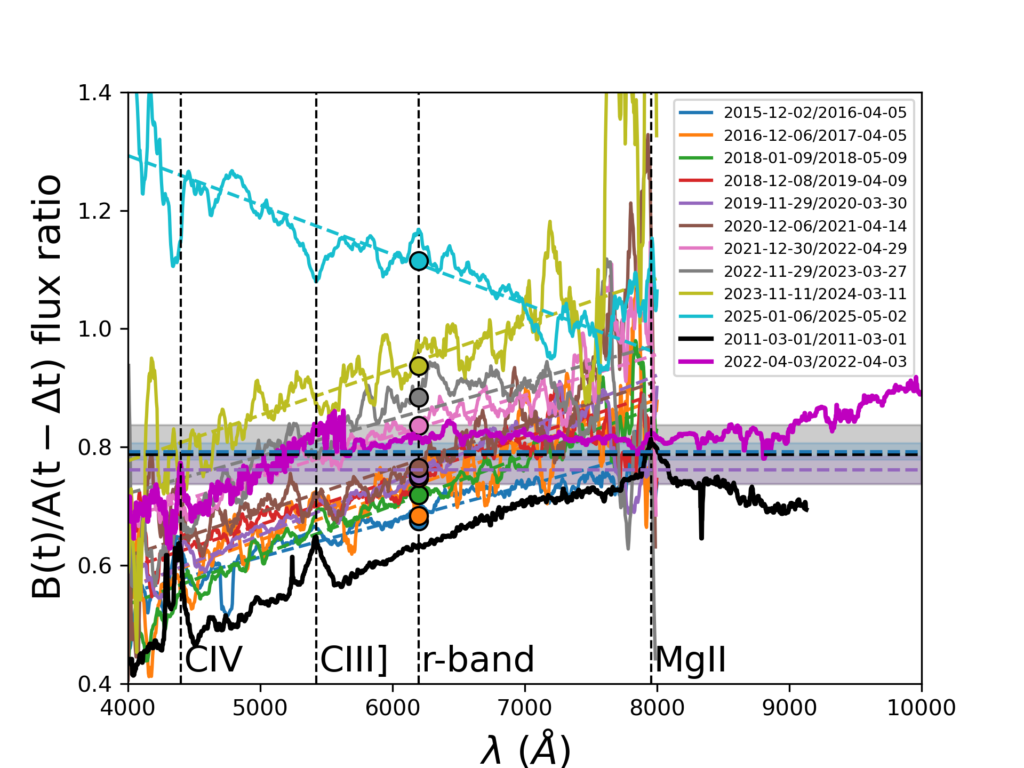
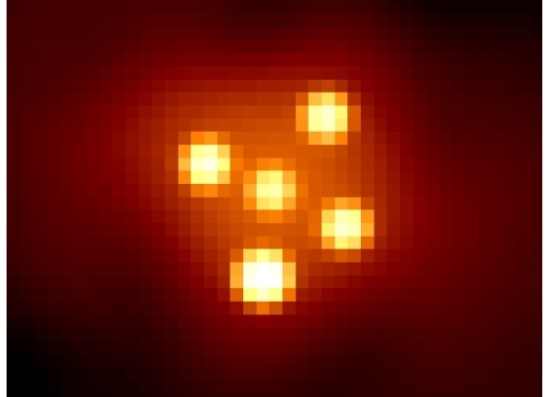
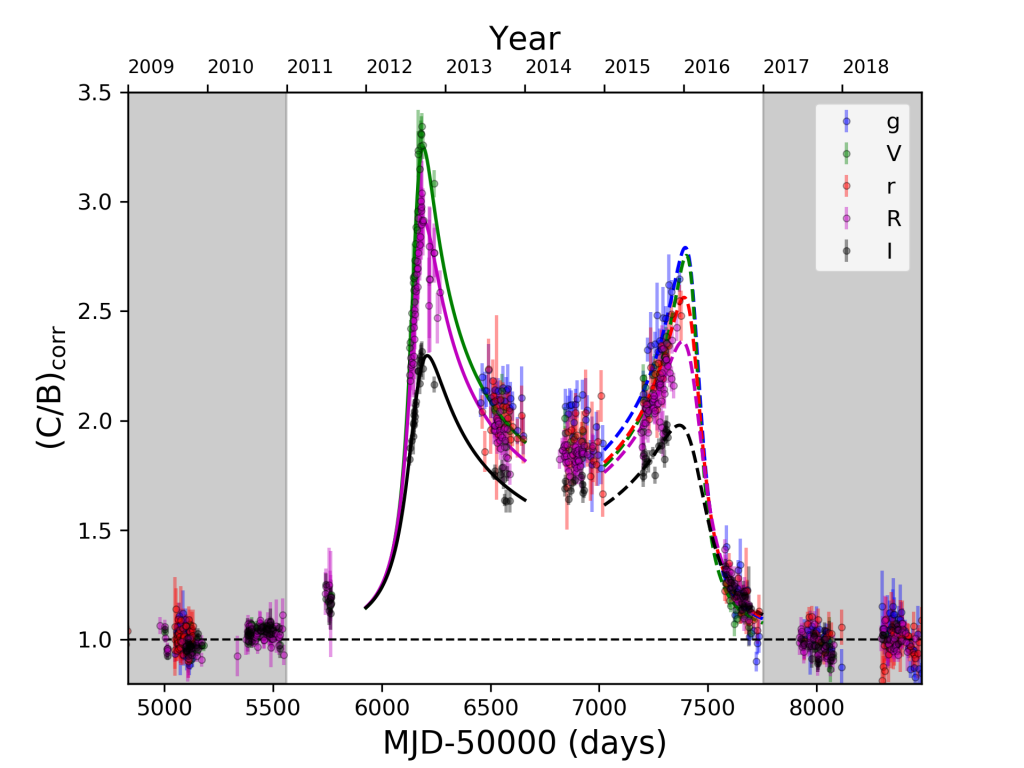
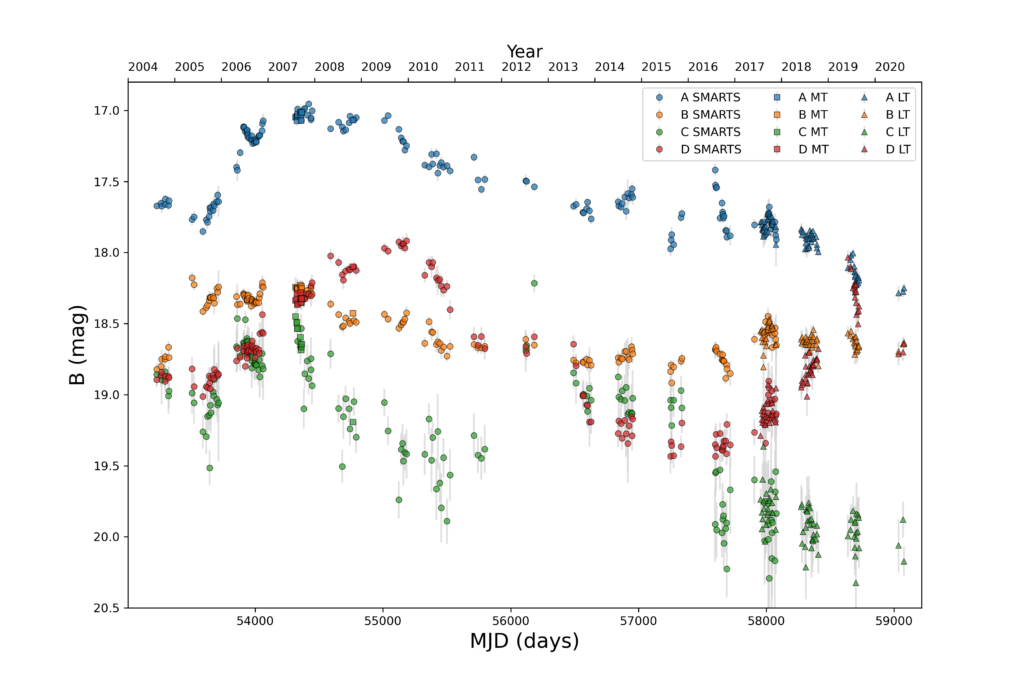
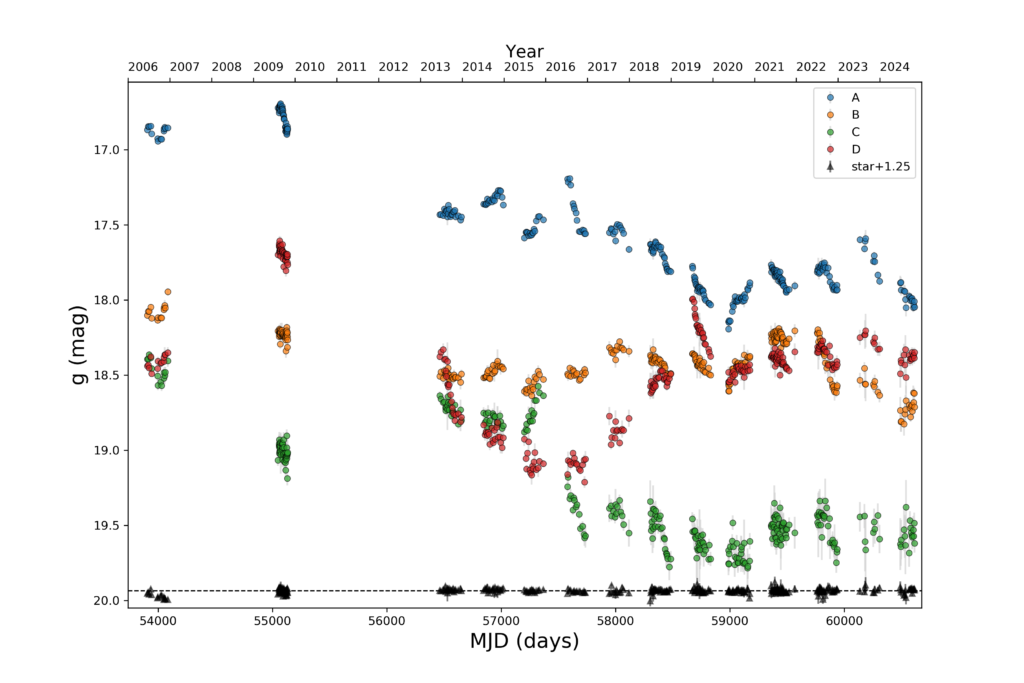
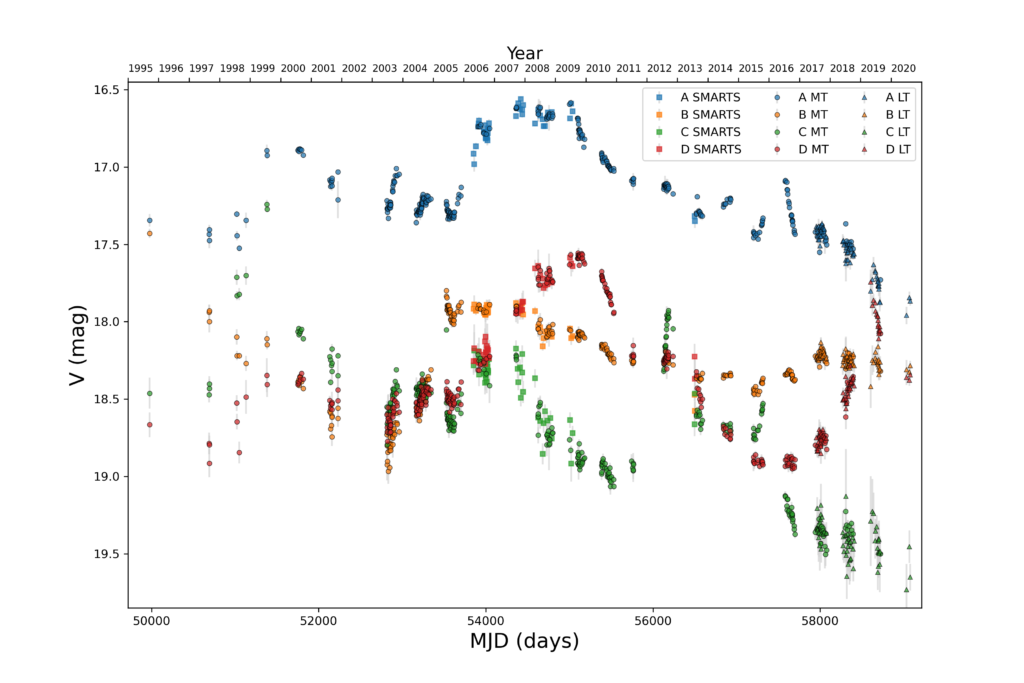
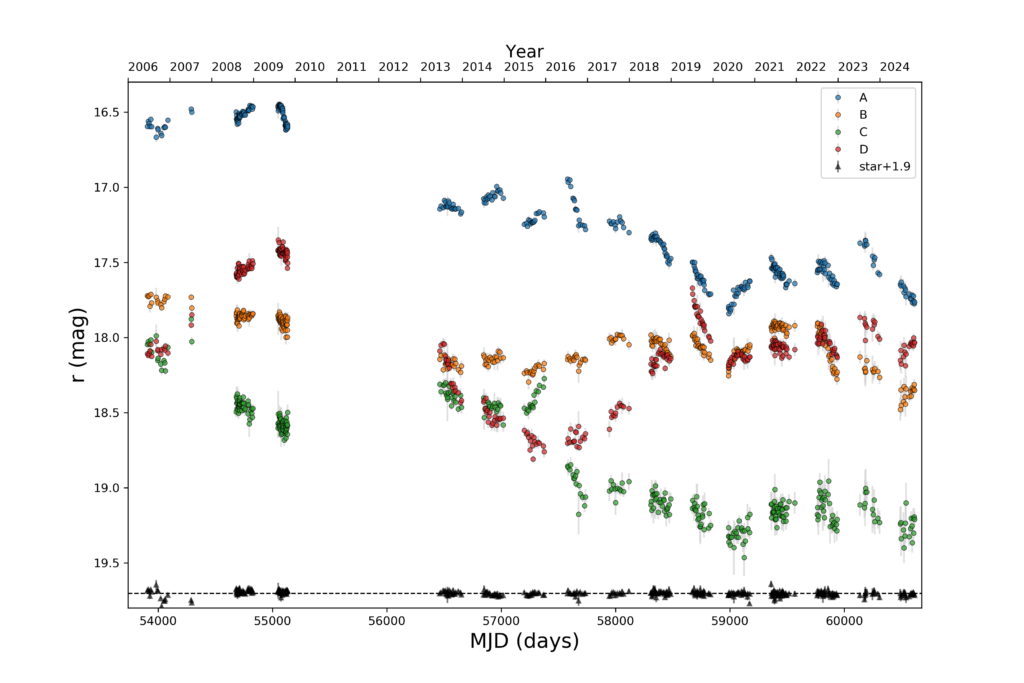
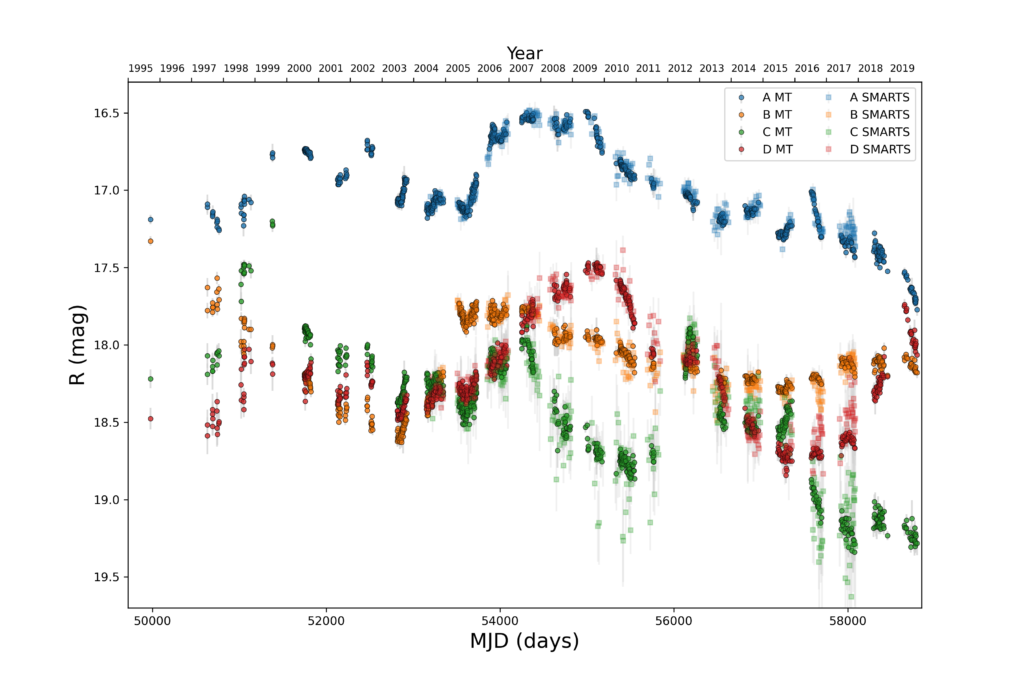
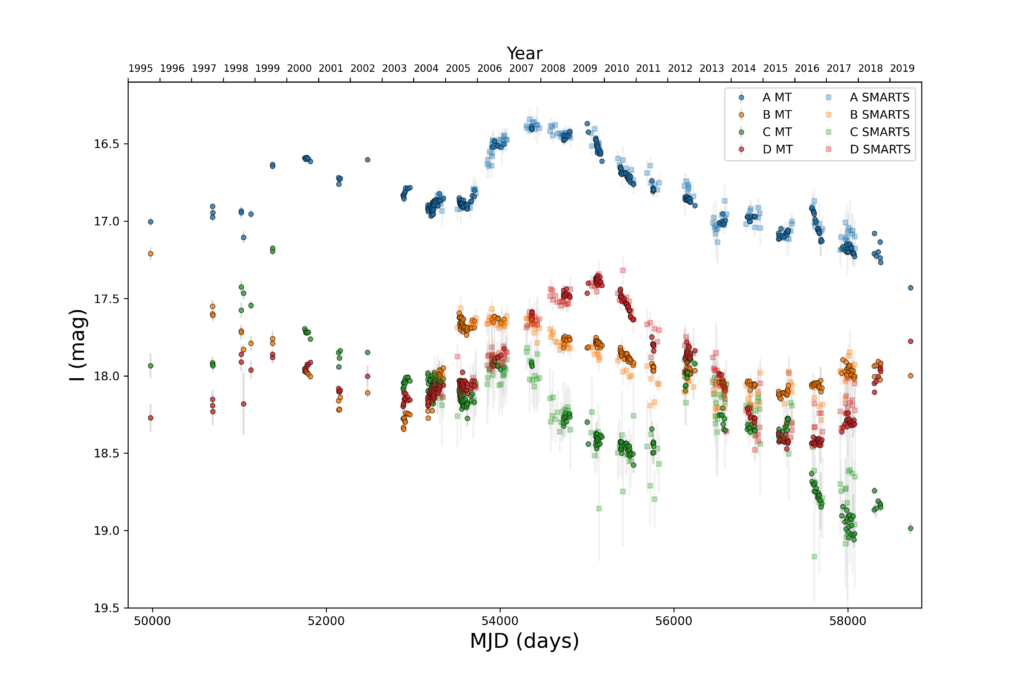
We present an optical monitoring of the quadruply-imaged gravitationally lensed quasar QSO 2237+0305, the Einstein Cross, including observations from three different observatories in both hemispheres and using a new photometric technique (see paper). This technique uses a region far enough from the lens system to accurately determine the sky background level and minimises contamination from the lensing galaxy by combining analytical and numerical modelling of its structure. The resulting light curves of the four quasar images describe variations across practically the entire optical spectrum and span about 9000 days in the VRI bands (see figures below).

A preliminary microlensing analysis reveals an almost linear scaling of the source radius with wavelength, providing direct evidence for the wavelength-dependent structure of the region contributing to optical passband fluxes. To account for random motions of stars, we create
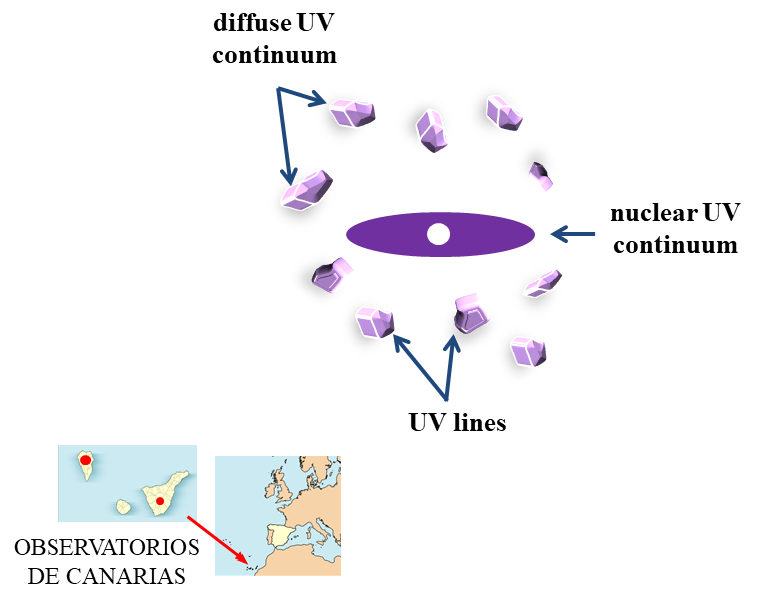
dynamic maps (animated sequences of static magnification patterns) that we call magnification cubes (see below). Assuming a mean microlens mass ⟨M⟩ = 0.3 M and concentric Gaussian sources that move according to the velocity distribution peaks (speed and direction) reported in a previous microlensing analysis, we find that the half-light radius of the g-band source is 9.6 ± 2.7 lt-day and the size of the sources grows with wavelength with a power-law index of α = 0.94 ± 0.05. This slope is shallower than the standard disc model at ∼8σ significance. Even assuming a possible underestimation of the error in α by a factor of two or three, there are serious difficulties for a standard accretion disc as the sole source of UV-optical continuum radiation in QSO 2237+0305. Although a non-standard accretion disc model can reproduce the observations, optical passband fluxes come from the central accretion disc and the broad emission-line region, so the measured relationship between source size and wavelength could be considerably flattened if the contribution of the extended region is substantial.

Animated sequence of magnification maps corresponding to 25 simulation steps of 0.2 Einstein radii each. The white line is the source trajectory across the sky, which is rotated in the B, C, and D magnification cubes with respect to cube A because of misalignments between the coordinate systems. For each quasar image, the shear direction coincides with the X-axis on the corresponding magnification map, and the four shear directions form different angles with celestial north.

Categorías
A&A HIGHLIGHTS

Near-IR spectroscopy of the gravitationally lensed quasar PS J0147+4630

Near-IR spectra of the four images of the gravitationally lensed quasar PS J0147+4630 at redshift z > 2 are presented for the first time. Using archive data of two 10-m class telescopes, we analyse the unexplored near-IR spectral region including the Mgii, Hβ, [O iii] and Hα emission lines (0.9−2.4 μm). We obtain the image flux ratios for the emission lines and their underlying continua, and measure a reliable quasar redshift of 2.357 ± 0.002. We also find evidence of an outflow in the Hα emission and estimate a quasar black-hole logarithmic mass

log [MBH/M] = 9.34 ± 0.30 (see paper).


Categorías
A&A HIGHLIGHTS

Changing-look of the delay-corrected spectral flux ratio of SDSS J1001+5027

We conducted a long-term optical monitoring of the doubly-imaged gravitationally lensed quasar SDSS J1001+5027 consisting of spectrophotometric observations separated by Δt ∼120 days (time delay between both quasar images) and test/auxiliary data. This monitoring approach allowed us to reliably find a strong microlensing-induced chromatic variation of the quasar continuum in the period
2022−2025. The ongoing microlensing event has caused a dramatic changing-look of the delay-corrected spectral flux ratio in 2025 (see paper). The current status of this flux ratio is being tested through observations with the Liverpool Telescope in January and May 2026.

Delay-corrected spectral flux ratio of SDSS J1001+5027 using the SPectrograph for the Rapid Acquisition of Transients (SPRAT) on the Liverpool Telescope at 25 epochs. We also show the delay-corrected r-band flux ratio (filled circles), and the single-epoch
spectral flux ratio from Gemini North/GMOS (black line) and Keck/LRIS (deep purple line). The three horizontal strips correspond to the Civ (purple), Ciii] (blue), and K-band (grey) flux ratios, which are used to highlight the macrolens flux ratio.

Categorías
A&A HIGHLIGHTS

FBQ 0951+2635: time delay and main lensing galaxy

We combined early and new optical light curves of the doubly-imaged quasar FBQ 0951+2635 to robustly measure a delay of 13.5 ± 1.6 d (1σ interval). This new time-delay interval and a relatively rich set of further observational constraints allowed us to discuss the mass structure of the main lensing galaxy at a redshift of 0.26. When modelling the galaxy as a singular power-law ellipsoid without hypotheses or priors on the power-law index, ellipticity, and position angle, we demonstrated that its mass profile is close to isothermal, and there is a good agreement between the shape of the mass distribution and that of the near-IR light. We also found that a constant mass-to-light ratio model works acceptably well (see paper).

We developed easy-to-use Python scripts to estimate the time delay of a multiple-image quasar with two different methods incorporating polynomial microlensing variability. These scripts are publicly available at GitHub.

In a subsequent paper, we focused on the main lensing galaxy for probing possible populations of primordial black holes (PBHs), since dark matter in galaxies may consist of PBHs formed soon after the initial Big Bang. Assuming that the mass of the galaxy is due to smoothly distributed matter (SDM), stars, and PBHs, 16-yr microlensing variability observations were compared in detail with simulated microlensing signals generated by 90 different physical scenarios. While none of the scenarios considered can reproduce the overall observed signal, the observed long-term variability favours a small mass fraction in PBHs with a mass of the order of the mean stellar mass. Furthermore, it is possible to obtain strong constraints on the galaxy mass fraction in Jupiter-mass PBHs, provided that a reverberation-based measurement of the source size is available and relatively small. To constrain the mass fraction in ∼10 M PBHs, light curves five times longer are probably required.

Comparison between the observed difference light curve (ODLC) and simulated difference light curves (SDLCs) for four physical scenarios. After generating 105 SDLCs from each pair of magnification maps, we show the best-fit SDLC (left panels) and ten randomly chosen SDLCs that are characterised by a root mean square of relative residues less than 2.60 (out of a total of n; right panels). The results for the standard scenario without PBHs are depicted in the first row from the top (n=10919), and those for the non-standard scenarios with PBHs are shown in successive rows: 45% of the mass in Jupiter-mass PBHs (n=1536; second row), 81% of the mass in ∼0.1M PBHs (n=152; third row), and 45% of the mass in ∼10M PBHs (n=13381; fourth row).

Categorías
News

Revealing the origin of the UV light emitted by Q0957+561

It is thought that the UV emission of a quasar is mainly generated in an accretion disc around a central supermassive black hole and gas clouds surrounding the accretion disc. This accretion disc produces the nuclear continuum, while the diffuse continuum and broad emission lines are generated in the clouds around the central engine (see Fig. 1).

Fig. 1: A long-term monitoring of the variability of Q0957+561 using optical telescopes at Canary Islands allowed us to uncover the contribution to the UV emission of the quasar from different sources. Although the accretion disc around the central black hole (nuclear source) produces ~80% of the UV light, an appreciable fraction (~20%) of the UV emission is generated by gas clouds surrounding the disc. This circumnuclear emission includes both a diffuse continuum (lighter areas of the clouds) and broad lines (darker areas of the clouds).

The first lensed quasar (Q0957+561) has two optically bright and widely separated images whose brightness has been accurately monitored during the last 25 years from frames taken at Teide and Roque de los Muchachos Observatories (Observatorios de Canarias; see map on the bottom left corner of Fig. 1).  As optical passband fluxes of this quasar are related to UV sources, the optical light curves of Q0957+561 revealed the origin of its UV emission. Using the light curves in the g and r bands, we found that about 20% of the UV emission corresponding to these passbands is generated within the gas clouds in the circumnuclear region (see this paper). It is also important to emphasize that the tension between the accretion disc size from microlensing and its reverberation-based value may be due to an overestimation from microlensing studies, which usually neglect the contribution of the circumnuclear emission and derive effective sizes (accretion disc + circumnuclear region).

Categorías
News

Cosmology from gravitationally lensed quasars

For a flat ΛCDM (standard) cosmology, there is a tension between the estimation of the Hubble constant H0 (current expansion rate of the universe) from observations of the cosmic microwave background and measurements of H0 from late-universe probes, e.g., using SNe data or time delays of gravitationally lensed quasars. Trying to check if this tension is real or not, we are using observational constraints for lensed quasars of the GLENDAMA sample to discuss the underlying value of H0 in a standard cosmology.

In addition to an initial test on H0 using two double quasars (see this paper), a student at the UC performed a MSc thesis based on GLENDAMA observations of six double quasars. This thesis focused on the mass distributions of the lensing galaxies and the H0 value. A preliminary result (not based on a comprehensive analysis of each system) was H0 = 72.1 ± 2.4 km s−1 Mpc−1, supporting several other results from late-universe probes, but also including measurements from early-universe probes within the 2σ interval (see Fig.1).

Fig. 1: Individual values of h = H0 (km s−1 Mpc−1)/100 using five double quasars. The combined measurement is also shown (black). These Results correspond to a flat ΛCDM (standard) cosmology with matter and dark energy densities of ΩM = 0.3 and ΩΛ =0.7.

We have also discussed the relationship between the mass distribution and H0 from data of the quad PS J0147+4630 (see this paper). This recent study is based on accurate measurements of the three independent delays relative to the faintest image D using our GLENDAMA data and NOT data obtained by the gravitational lensing group at the University of Oslo (see Fig. 2). We also collaborated in a project to discuss the non-parametric mass distribution of the lensing cluster SDSS J1004 + 4112 and the H0 value from measured delays of the associated five-image quasar SDSS J1004 + 4112 (it is not a target of the GLENDAMA sample and was not observed by us, but is an interesting case in which non-parametric mass reconstructions are used; see paper).

Fig. 2: Time-delay estimates using the chi-square technique and free-knot splines (based on PyCS3 software)

Categorías
News

Updating the microlensing simulator (ML simulator): moving stars in the lensing galaxy

We are updating our current ML simulator at https://microlensing.overfitting.es/ by adding a new ingredient: motions of microlenses. Here below you can find an example. In this example, we consider a point-like source. Additionally, both convergence and shear strength are equal to 0.3, and all mass is due to identical stars (microlenses). The physical size of the magnification map covers 20 Einstein radii with a length side of 2000 pixels. The movie lasts 2 minutes, corresponding to the real time of the simulation in a laptop with i5 processor and 16 GB RAM.

Categorías
News

Accretion discs around supermassive black holes

As part of a collaborative research programme between the gravitational lensing groups at the UC, United States Naval Academy (USNA) and other institutions, we have measured the central black hole mass of the doubly-imaged quasar SDSS J1339+1310 using GTC and VLT spectroscopic data. We infer Log(M/solar mass) = 8.6+0.4−0.4 from the widths of the Civ, Mgii, and Hbeta emission lines, and the continuum luminosities at 1350, 3000, and 5100 Å (see figure below). In addition, the 2009-2019 LT light curves in the r band showed significant microlensing variations that allowed us to constrain the half-light radius of the 1930 Å continuum-emitting region. Hot gas responsible for this continuum emission is likely orbiting a black hole of four hundred million solar masses at a half-light radius of only a few tens of Schwarzschild radii.

Paper: Resolving the inner accretion flow towards the central supermassive black hole in SDSS J1339+1310 by V. N. Shalyapin, L. J. Goicoechea, C. W. Morgan, M. A. Cornachione, A. V. Sergeyev [A&A 646, A165 (2021)]

Updated optical-NIR light curves of the gravitationally lensed quasars Q0957+561 and SBS0909+532 also display prominent microlensing features. Using a Bayesian Monte Carlo technique developed at the USNA, these features were analysed to constrain the quasar continuum emission region sizes in the g, r, and H passbands. We report sizes as half-light radii scaled to a 60° inclination angle. For Q0957+561 we measure Log(R1/2 /cm) = 16.54+0.33−0.33 , 16.66+0.37−0.62 , and 17.37+0.49−0.40 in the g, r, and H bands, respectively. For SBS0909+532 we measure Log(R1/2 / cm) = 15.83+0.33−0.33 , 16.21+0.37−0.62 , and 17.90+0.61−0.63 in the g, r, and H band respectively. With size measurements in three bands spanning the quasar rest frame UV to optical, we can place constraints on the scaling of accretion disc size with wavelength, Rλλa . In a joint analysis of both systems we find a slope shallower than that predicted by thin-disc standard theory, a = 2.86+0.84−0.90 (astd = 1.33).

Paper: Near-infrared and Optical Continuum Emission Region Size Measurements in the Gravitationally lensed Quasars Q0957+561 and SBS0909+532 by M. A. Cornachione, C. W. Morgan, H. R. Burger, V. N. Shalyapin, L. J. Goicoechea, F. J. Vrba, S. E. Dahm, T. M. Tilleman [ApJ 905, A7 (2020)]

Categorías
Divulgación Astronomía

Cosmos del siglo XXI

Más de medio centenar de científicos recogen el guante lanzado por Alicia Parra y Quintín Garrido para homenajear y actualizar el COSMOS de Carl Sagan en el 40 aniversario del estreno de la serie en televisión y de la publicación del libro.
Este homenaje se plasma siguiendo la línea, estructura, utilizada en el libro original. Los autores participantes, tras la elección de un tema tratado en COSMOS, desarrollan su aportación con un lenguaje claro y riguroso, a modo de continuación del legado divulgativo iniciado por Carl Sagan.
Este libro se presenta bajo Licencia Creative Commons y en formato de archivo pdf para su descarga gratuita. Tanto la descarga como la lectura en línea se realiza a través del blog:
https://cienciayelcosmosdelsigloxxi.blogspot.com/

El grupo de lentes gravitatorias de la UC ha contribuido al proyecto con un capítulo dedicado a la Gravedad y sus efectos (versión en castellano) – Gravity and its effects (English version)

Categorías
A&A HIGHLIGHTS

First detection of a double caustic crossing in a microlensed quasar

Fig. 1: Einstein Cross: four quasar images around the nucleus of a lens galaxy (centre)

The Einstein Cross consists of four images (A, B, C, and D) of a distant quasar that is located about 8,000 million light years from Earth. The A-D images are arranged like a cross around the nucleus of a nearly face-on spiral galaxy at a distance of 400 million light years (see Fig. 1 above). The light of this quadruply-imaged quasar passes through four different regions in the bulge of the lensing spiral galaxy, and thus each quasar image is gravitationally affected by a different stellar population. These stellar populations are responsible for the so-called microlensing effects.

Microlenses (stars) affect each gas ring in an accretion disc to a different extent, so that more compact (hotter and bluer) sources are expected to suffer stronger effects. Therefore a monitoring of the multi-wavelength microlensing-induced variability of a lensed quasar can be used to probe the structure of its accretion disc. Due to the motions of the quasar, lens galaxy and observer, the images of the Einstein Cross are thought to cross caustic folds, where their fluxes suffer high magnifications. However, although caustic regions are surrounded by such folds, only single-fold crossings have been detected previously: sources entering caustics or exiting from them. To detect a double caustic crossing (including both the entry and exit of a caustic region), an accurate long-term monitoring is required… and also being lucky!

Fig. 2: Liverpool-Maidanak double caustic-crossing event in the Einstein Cross [from figure 3 in A&A 637, A89 (2020)]
Fig. 3: The accretion disc of the Einstein Cross (red circle) enters and then exits of a caustic region for image C by crossing two of its folds. The caustic network for this quasar image has been simulated using realistic parameters

A collaboration between several research teams exploiting two main astronomical facilities in the Northern Hemisphere has finally led to the detection of the first double caustic-crossing. This collaborative project has involved astronomers of Russia (Sternberg Astronomical Institute of Lomonosov Moscow State University), Spain (UC), Ukraine (National Academy of Sciences of Ukraine and Institute of Astronomy of V.N. Karazin Kharkiv National University), and Uzbekistan (Ulugh Beg Astronomical Institute of the Uzbek Academy of Sciences and National University of Uzbekistan), who conducted a 14-year (2006–2019) monitoring campaign of the Einstein Cross. The project relied on 4,374 frames taken from the 2.0 m Liverpool Telescope (using gr Sloan filters) and the 1.5 m telescope at the Maidanak Observatory (using VRI Bessell filters). After analysing all frames in a homogeneous way, the researchers have found a double-horn microlensing-induced flux variation (see Fig. 2) that is the signature of a double caustic-crossing of image C (see Fig. 3). A standard accretion disc accounts reasonably well for the observations (e.g. the derived relationship between source radius and emission wavelength λ is Rλ ∝ λα, α = 1.33 ± 0.09), although numerical microlensing simulations are required before firm conclusions can be reached. The associated paper has been recently published in Astronomy & Astrophysics (A&A). This paper has been selected as an A&A Highlight in 2020.

Paper: Liverpool-Maidanak monitoring of the Einstein Cross in 2006–2019. I. Light curves in the gVrRI optical bands and microlensing signatures by L. J. Goicoechea, B. P. Artamonov, V. N. Shalyapin, A. V. Sergeyev, O. A. Burkhonov, T. A. Akhunov, I. M. Asfandiyarov, V. V. Bruevich, S. A. Ehgamberdiev, E. V. Shimanovskaya and A. P. Zheleznyak [A&A 637, A89 (2020)]